1232
Views & Citations232
Likes & Shares
The growth and yield of black rice is affected by the plant population and nitrogen management. A field experiment was conducted during rainy season of 2016 to assess the growth and productivity of black rice under different plant population and nitrogen management in Rampur, Chitwan. The experiment was laid out in strip plot design with three replications. The treatment consisted of combination of three crop geometry (20 cm × 20 cm, 20 cm × 15 cm and 15 cm × 15 cm) in vertical plots and three nitrogen management practices (N level: 30 kg N ha-1, 60 kg N ha-1, and LCC based N-management) in horizontal plots. The result revealed that grain yield of black rice was highest (1.59 t ha-1) at the closer spacing of 15 cm × 15 cm with LCC based N management. The yield was similar with the yield at closer spacing of 15 cm × 15 cm with 60 kg ha-1 N application. The grain yield LCC based N management was also significantly higher at 60 kg ha-1 N applied plot. Therefore black rice can be grown profitably in Terai environment at closer spacing of 15 cm × 15 cm with LCC based N management or with 60 kg ha-1 N application. The overall analysis revealed that LCC based N management under closer crop geometry (15 cm × 15 cm) was the best management practices because of higher grain yield.
INTRODUCTION
Black rice is a type of pigmented rice in which pericarp or kernel is black or deep purple in color due to deposition of anthocyanin. Anthocyanin has the property of antioxidant that makes black rice subject of exploration, research for its potential biomedical application [1]. Black rice is super food having high value; cultivation of this rice brings high net economic return as well as consumption of this rice keep person healthy. This rice cultivation is new in the climate of inner Terai of Nepal like Chitwan.
For cultivation of any new crop in new domain its cultivation practices, input requirement should be well known. From literatures it is well known that right amount of nitrogen in right time have positive influence on yield and yield components of rice. Earlier studies reveal that judicious and proper use of fertilizers can markedly increase the yield and improve the quality of rice [2]. Similarly proper crop geometry, i.e., distance between crop and between rows is prerequisite for better output. The crop geometry and plant spacing should be optimized by keeping in mind different aspects of cropping management techniques. Crop geometry significantly influence the tillering habit and formation of spikelets per panicles and responsible for the grain yield per unit area of rice [3]. Black rice var. G60 is low tillering in character with short height, and less responsive to applied fertilizer [1]. Grain yield decline as planting geometry increased from 15 cm × 15 cm to 25 cm × 25 cm for low tillering rice cultivars whereas in high tillering cultivars reverse trend was noticed [4].
MATERIALS AND METHODS
The experiment was laid out in strip plot design with two factors with three replications. The horizontal factor comprised of three crop geometry (20 cm × 20 cm, 20 cm × 15 cm and 15 cm × 15 cm) and vertical factor comprised three nitrogen management practices (30 kg N ha-1, 60 kg N ha-1 and LCC based N application). The size of unit plot was 3 m × 4.2 m.
Black rice (var. G 60) seedlings were raised in well prepared dry seed bed. Rice seed were sown on June, 2016 with the seed rate of 50kg ha-1. The nursery bed was fertilized using Urea and SSP with 2.25 g m-2 and 50 g m-2, respectively and mulched using wheat straw. Frequent irrigation through hand watering jar was given to recover the seedling from drought. 26 old seedlings were uprooted carefully from the nursery and transplanted (2-3 seedlings/hill) on the well puddled experimental plots with three crop geometry as treatments. Full dose of phosphorous, potash and 25 kg ha-1 ZnSO4 were applied as basal dose. Basal doses of nitrogen were applied in 30 kg ha-1 and 60 kg ha-1 nitrogen treatment @ 30 kg ha-1. Remaining nitrogen dose of treatment 60 kg ha-1 was applied during active tillering stage after first hand weeding. In LCC no nitrogen was applied as basal dose. First reading of LCC was done at 15 DAT the value of LCC was found below critical (<4) and 30 kg ha-1 nitrogen was applied at a time. Similarly 2nd split of nitrogen using LCC was applied at 36 DAT which was 3rd reading of LCC. Irrigation along with other intercultural operations was done as and when required. The crop of individual plots was separately harvested at full maturity. Data on Phenology, plant height, above ground dry matter (AGDM), Leaf area index (LAI), total number tillers and effective tillers m-2, panicle length, panicle weight, number of grains/panicle, weight of 1000 grain were collected from twenty sample plants of each plot. The grain weights for each plot were recorded after proper drying in sun. The collected data were statistically analyzed and mean differences were compared by Duncan’s New Multiple Range Test (DMRT).
RESULTS
Biometrical observation
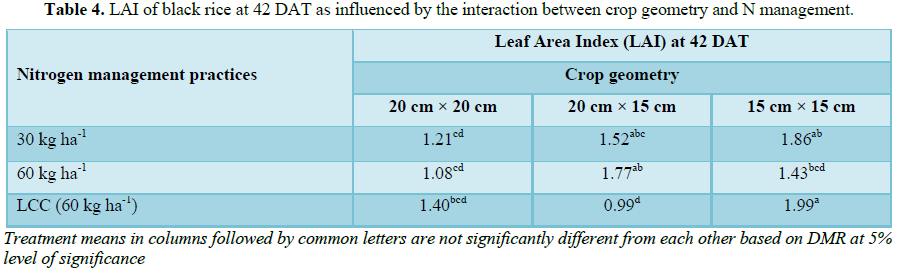
The LAI of black rice at 42 DAT was significantly influenced by the interaction between crop geometry and N management (Table 4). The highest LAI (1.99) at 42 DAT was obtained at a closer spacing (15 cm × 15 cm) with LCC based N management. This treatment was statistically similar with 15 cm × 15 cm with 30 kg ha-1 N followed by 20 cm × 15 cm with 30 and 60 kg ha-1 N and superior to all other treatments. The LAI at 42 DAT were lower at a wider spacing of 20 cm × 20 cm with 30, 60 kg ha-1 N and LCC based nitrogen management.
Yield attributing characters of black rice as influenced by crop geometry and nitrogen dose
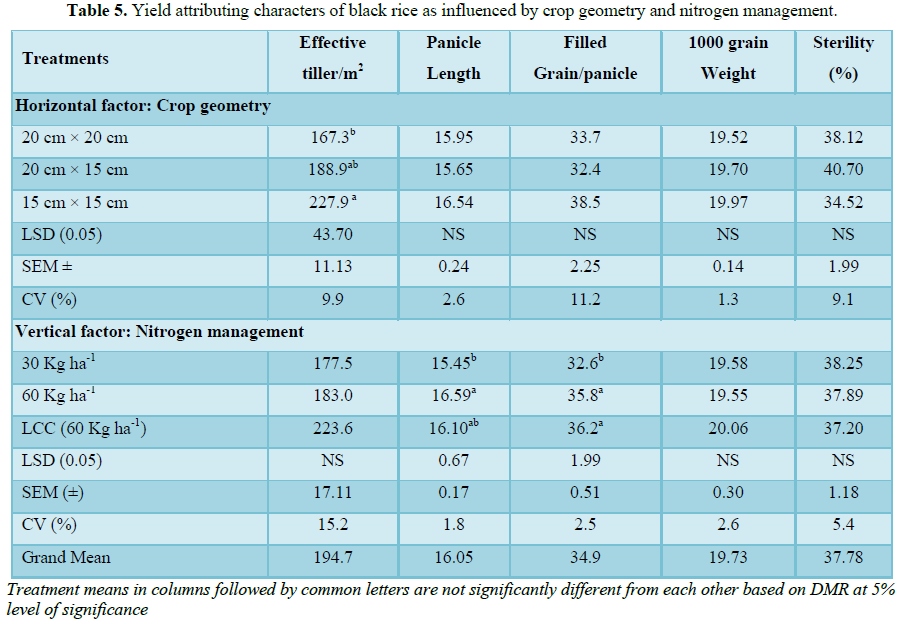
Effective tillers per square meter: The mean ET m-2 was 194.7 in the experiment and was significantly influenced by crop geometry but not by nitrogen management (Table 5). The highest number of ET m-2 (227.9) was obtained at a closer spacing of 15 cm × 15 cm. This treatment was statistically similar with (188 ET m-2) crop geometry 20 cm × 15 cm but superior to 20 cm × 20 cm (167.3 ET m-2). The ET m-2 increased with closer spacing. The ET m-2 due to N management were statistically similar among the treatments but it showed the remarkably increasing number of ET m-2 with increased dose; at 30 kg ha-1 (177.5 ET m-2), 60 kg ha-1 (183 ET m-2) of N and LCC based N management (223.6 ET m-2).
Panicle length: The mean panicle length in the experiment was 16.05 cm. The panicle length was significantly influenced by nitrogen dose but the effect of crop geometry and interaction among treatments on panicle was found as par (Table 5). The panicle length (16.6 cm) of Black rice was significantly higher at nitrogen dose applied at the rate of 60 kg ha-1 as compared with nitrogen dose 30 kg ha-1 (15.5 cm) and statically similar (16.1 cm) with nitrogen dose 60 kg ha-1 applied using LCC. Similarly, there was non-significant effect on panicle length due to crop geometry. Relatively longer panicle of Black rice (16.5 cm) was recorded with a spacing of 15 cm × 15 cm whereas relatively shorter panicle (15.7 cm) was recorded with spacing 20 cm × 15 cm.
Panicle weight: The mean panicle weight in the experiment was 0.99 g. The panicle weight was significantly influenced by nitrogen dose but the effect of crop geometry and interaction among treatments on panicle weight was found as par (Table 5). The panicle weight (1.038 g) of Black rice was significantly higher at nitrogen dose applied at the rate of 60 kg ha-1as compared with nitrogen dose 30 kg ha-1 (0.93 g) and statically similar (1.04 g) with nitrogen dose 60 kg ha-1 applied using LCC.
Filled grain per panicle: The mean filled grain per panicle of Black rice was 34.9 (Table 5). The filled grain per panicle was significantly influenced by nitrogen dose. Maximum number of filled grain (36.2) were found when nitrogen was applied at the rate of 60 kg ha-1using leaf color chart and lowest number (32.6) were observed with nitrogen dose 30 kg ha-1 but number of filled grain per panicle (35.8) were statistically at par with maximum number (36.2) when dose of nitrogen is applied at the rate of 60 kg ha-1 adopting split method. Similarly, the effect of crop geometry and interaction of crop geometry and nitrogen management were found non-significant. But relatively maximum number (38.5) of filled grains were observed at a spacing of 15 cm × 15 cm followed by (33.7) in 20 cm × 20 cm and lowest (32.4) in 20 cm × 15 cm.
Thousand grain weight: The average thousand grain weight (TGW) during the experiment was observed to be 19.73 g (Table 5). Thousand grain weight (TGW) of Black rice was not significantly influenced by factors like crop geometry, Nitrogen management and their interaction.
Sterility percentage: The mean sterility percentage of black rice was 24.47% (Table 5). The different level of nitrogen, different crop geometry, and their interaction didn’t significantly influence the sterility percentage but it ranged from 40.70% to 34.52% in the context of crop geometry whereas in case of nitrogen dose it ranges 38.25% to 37.20%.
Grain yield, straw yield and harvest index of black rice as influenced by crop geometry and nitrogen dose
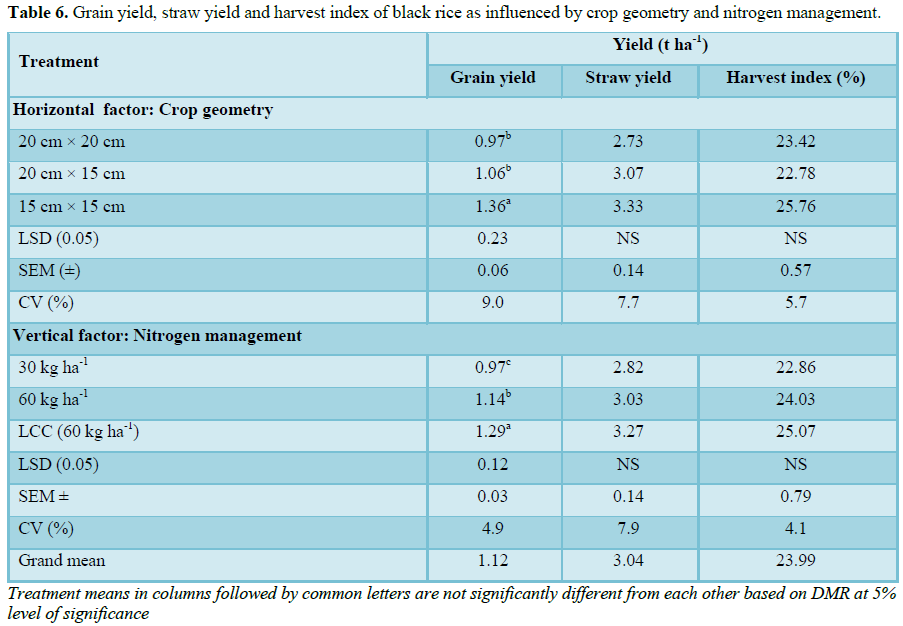
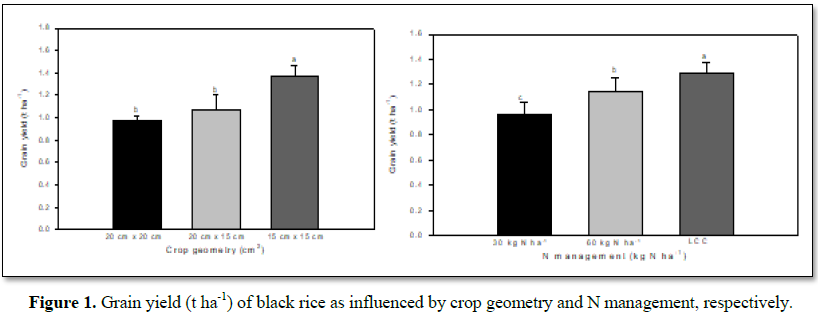
Grain yield (t ha-1): The mean grain yield of Black rice in the experiment was 1.1 t ha-1. The grain yield of black rice was significantly influenced by crop geometry as well as nitrogen dose and also due to their interaction (Table 6). The grain yield (1.36 t ha-1) of black rice was significantly higher at 15 cm × 15 cm spacing as compared with 20 cm × 20 cm (0.97 t ha-1) and 20 cm × 15cm (1.06 t ha-1) spacing (Figure 1). The grain yield at 20 cm × 20 cm and 20 cm × 15 cm were statically similar with each other. Similarly, the grain yield at LCC based N management was the highest (1.29 t ha-1) and it was significantly higher than N dose 30 kg ha-1 (0.97t ha-1) and 60 kg ha-1 (1.14 t ha-1) (Figure 1). The grain yield at N dose 60 kg ha-1 was significantly higher than grain yield of black rice at 30 kg ha-1 N application.
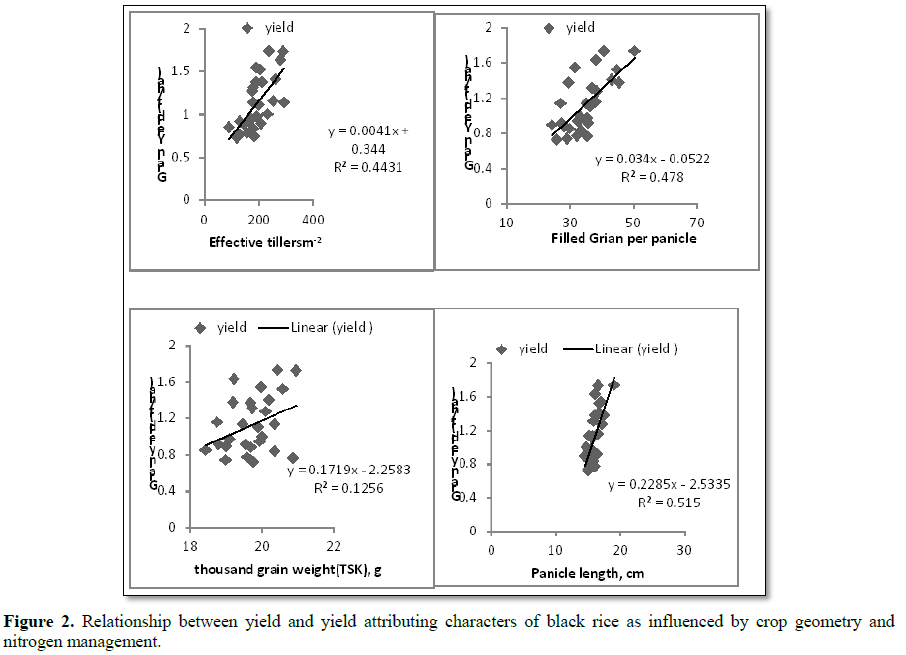
Relationship between yields attributes and grain yield: Grain yield obtained was significantly associated with the number of effective tillers per meter square (r=0.673**) in the crop geometry (Figure 2). Effective tiller had 44.31% determination on grain yield (Figure 2A). Similarly, grain yield was significantly associated with a number of grain panicle (0.681**), Panicle length (0.701**) on nitrogen management practices and their determination on grain yield as 47.8% and 51.5%, respectively.
Effective tillers were significantly associated with tiller numbers at 30DAT (r=0.467*), 42DAT(r=0.532**) and AGDM at 54DAT (r=0.396*). Similarly Panicle length was significantly associated with tiller numbers at 42 DAT(r=0.437*), LAI at 54 DAT(r=0.382*) and 66 DAT(r=0.562**), AGDM at 66 DAT(r=0.573**). Filled grain per panicle was significantly associated with panicle length (0.827**).
Straw yield: The mean straw yield of Black rice in the experiment was 3.04 t ha-1. The straw yield of Black rice was not significantly influenced by crop geometry as well as nitrogen management also not due to their interaction (Table 6). Though there is no significant effect among treatments but straw yield increases as nitrogen dose goes on increasing. Maximum straw yield (3.3 t ha-1) was found in N dose 60 kg ha-1 applied using LCC followed by 60 kg ha-1 and least (2.8t ha-1) was found in N dose 30 kg ha-1. Similarly, the straw yield was not significantly affected by crop geometry but it goes on increasing as the spacing between crops and rows goes on decreasing. Maximum yield (3.3 t ha-1) was observed in spacing 15 cm × 15 cm followed (3.1 t ha-1) by 20 cm × 15 cm and least (2.7 t ha-1) was found in 20 cm × 20 cm.
Harvest index: The harvest index of Black rice in the experiment was 23.99%. The Harvest index of Black rice was not significantly influenced by crop geometry as well as nitrogen management (Table 6). Though there is no significant difference among treatments but HI increases as nitrogen dose goes on increasing. Maximum HI (25.07%) was found in N dose 60 kg ha-1 applied using LCC followed by 60 kg ha-1 and least (22.86%) was found in N dose 30 kg ha-1. Similarly, the HI was not significantly affected by crop geometry but maximum HI (25.76%) was observed in spacing 15 cm × 15 cm followed (23.42%) by 20 cm × 20 cm and least (22.78%) was found in 20 cm × 15 cm. The grain yield of Black rice was significantly influenced by the interaction between crop geometry and N management (Figure 3). The highest grain yield (1.59 t ha-1) was obtained at a closer spacing (15 cm × 15 cm) with LCC based management. This treatment was statistically similar with 15 cm × 15 cm with 60 kg N ha-1 followed by 20 cm × 20 cm with LCC based N and superior to all other treatments. The grain yields were lower at a wider spacing of 20 cm × 20 cm with 30 and 60 kg ha-1 N.
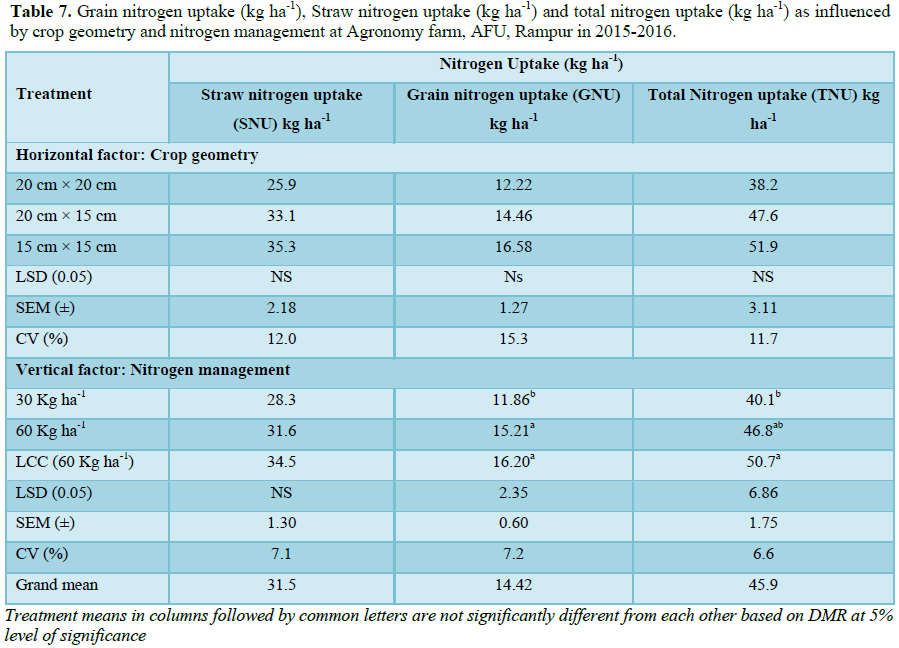
Nitrogen uptake in black rice: A Product of dry matter produced by the plant and nutrient content is called the nitrogen uptake by the plant. Nitrogen uptake generally parallels dry matter. Thus on an average, partitioning of nitrogen in straw, grain of Black rice was 31.5 kg ha-1 and 14.42 kg ha-1, respectively.
Straw nitrogen uptake: The mean Straw nitrogen uptake (SNU) was observed 31.5 t ha-1 and was found non-significant difference among the tested treatments at 5% level of significance (Table 7). The maximum (35.3 kg ha-1) straw nitrogen uptake was observed in spacing 15 cm × 15 cm and minimum (25.9 kg ha-1) in 20 cm × 20 cm spacing. Similarly in case of nitrogen management maximum (34.6 kg ha-1) was recorded in 60 kg ha-1 nitrogen dose applied using LCC and minimum (28.3 kg ha-1) straw nitrogen uptake was observed when nitrogen applied at the rate of 30 kg ha-1.
Grain nitrogen uptake: The mean grain nitrogen uptake of Black rice in the experiment was 14.42 t ha-1. The grain nitrogen uptake of Black rice was significantly influenced by nitrogen management and interaction between crop geometry and nitrogen management but not due to crop geometry (Table 7).
The grain nitrogen uptake (16.20 kg ha-1) of Black rice was significantly higher at nitrogen dose of 60 kg ha-1 applied using LCC as compared with nitrogen dose 30 kg ha-1 (11.86 kg ha-1). The grain nitrogen uptake (16.20 kg ha-1) at 60 kg ha-1 applied using LCC and at nitrogen dose, 60 kg ha-1 applied by splitting (15.21 kg ha-1) was statically similar to each other. Similarly the grain nitrogen uptake (16.58 kg ha-1) at spacing 15 cm × 15 cm was relatively higher than at spacing 20 cm × 15 cm (14.46 kg ha-1) and 15 cm × 15 cm (12.22 kg ha-1).
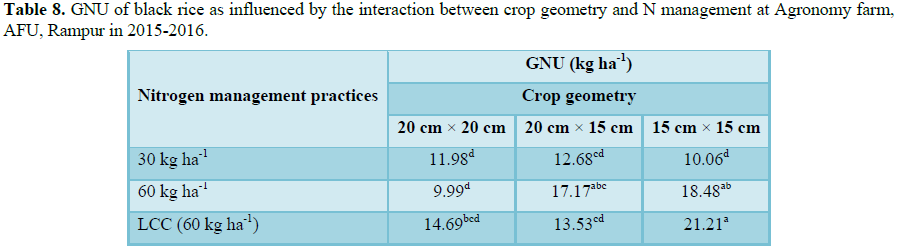
Total nitrogen uptake: The average total N uptake was 45.9 kg ha-1 and ranged from 40.1 to 50.7 kg ha-1. Total N uptake was significantly influenced by the nutrient management not by the crop geometry (Table 7). The crop geometry 15 cm × 15 cm had slightly higher total nitrogen uptake followed by 20 cm × 15cm and least in 20 cm × 20 cm. Similar total nitrogen uptake was highest (50.7 kg ha-1) for LCC based nitrogen management followed by nitrogen dose of 60 kg ha-1 (46.8 kg ha-1) which was statically at par with LCC based nitrogen management and least (40.1 kg ha-1) was found in nitrogen dose of 30 kg ha-1. The GNU was significantly influenced by the interaction between crop geometry and nitrogen management practices (Table 8). The highest GNU (21.21 kg ha-1) was obtained at a closer spacing (15 cm × 15 cm) with LCC based management. This treatment was statistically similar with 15 cm × 15 cm with 60 kg N ha-1 followed by 20 cm × 15 cm with 60 kg N ha-1 and superior to all other treatments. The GNU was lower at a wider spacing of 20 cm × 20 cm with 30 and 60 kg ha-1 N.
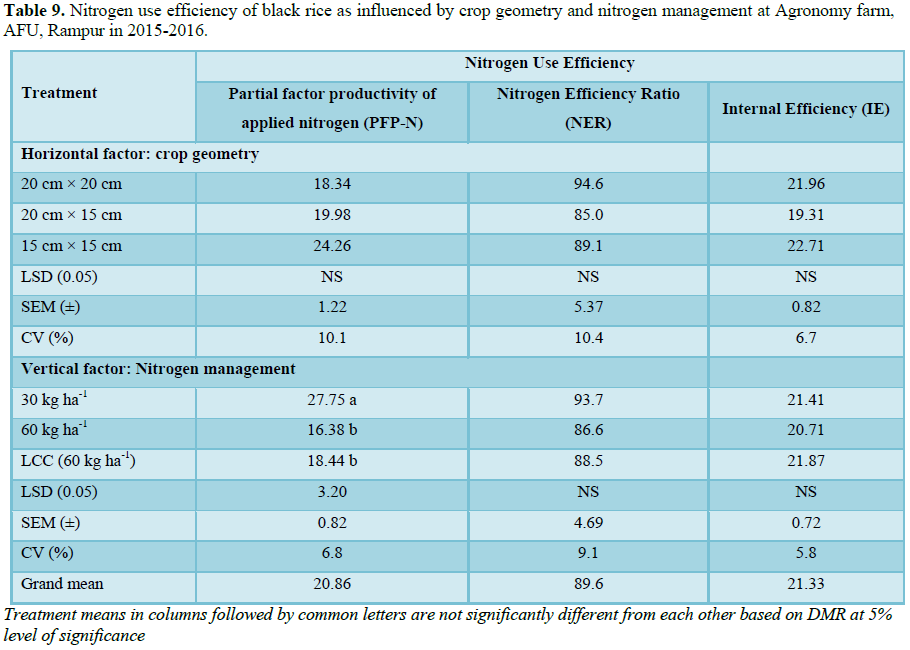
Nitrogen use efficiency:
Partial factor productivity - Nitrogen (PFP-N): Partial factor productivity was significantly influenced by different nitrogen management practices (Table 9). Nitrogen management with the rate of 30 kg ha-1 (27.75) was significantly higher nitrogen rate of 60 kg ha-1 (16.38) and nitrogen applied using LCC (18.44). But the partial factor productivity was not influenced by different crop geometry; comparatively higher partial factor productivity was observed in narrow spacing (15 cm × 15 cm) as compared to other.
Nitrogen efficiency ratio (NER): On an average, Nitrogen efficiency ratio was 89.6 (Table 9). Both Crop geometry and nitrogen management were not significant. Comparatively wider spacing (20 cm × 20 cm) and 30 kg ha-1 had higher nitrogen efficiency ratio as compared to other crop geometry and nitrogen management practices.
Internal efficiency (IE): On an average, Internal efficiency (IE) was 21.33 (Table 9). Both Crop geometry and nitrogen management were not significant. Comparatively narrow spacing (15 cm × 15 cm) and LCC (60 kg ha-1) had higher internal efficiency index as compared to other crop geometry and nitrogen management practices.
DISCUSSION
Effect of crop geometry
Effect of crop geometry on phenology and growth of black rice: Flowering and physiological maturity of black rice was found non-significant due to crop geometry (Table 1). The crop growth duration under the similar climatic condition is genetically controlled traits. Therefore spacing, as well as N management, did not influence days to flower and maturity.
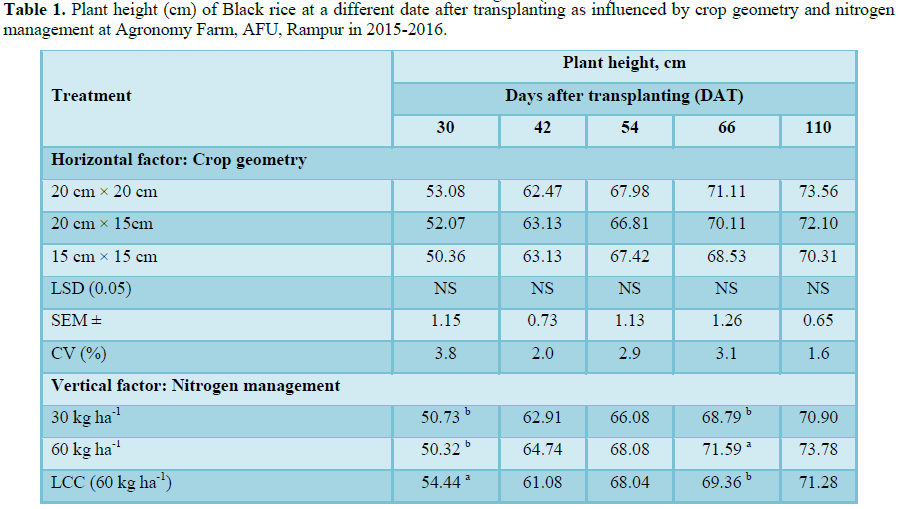
Plant height was non-significant throughout all growing stage (Table 2). But it was comparatively higher at wider geometry. Similarly, Salahuddin [5] found that sparsely populated plants were taller than closely populated plants. According to Das [6] under wider spacing, the plants get sufficient space above the ground (shoots) and below the ground (roots) to grow and the increased light transmission in the canopy, leading to greater plant height.
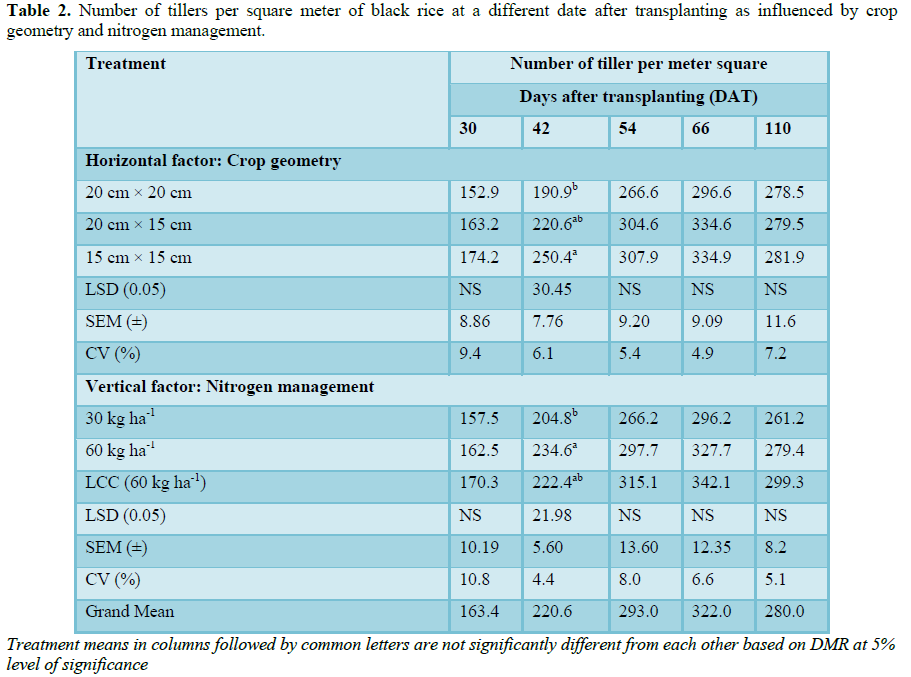
In general closer spacing (15 cm × 15 cm) had more number of tillers per square meter as compared with wider spacing of 20 cm × 15 cm and 20 cm × 20 cm but there was significantly more number of tillers as compared to wider spacing of 20 cm × 20 cm only at 42 DAT (Table 3). Unlike the wider geometry, there were more numbers of plants per meter square in closer geometry which increases the number of tiller per meter square [7,8] also reported higher tillers per meter square in closer geometry. A higher number of tillers per meter square resulted in higher effective tillers per meter square resulting higher grain yield.
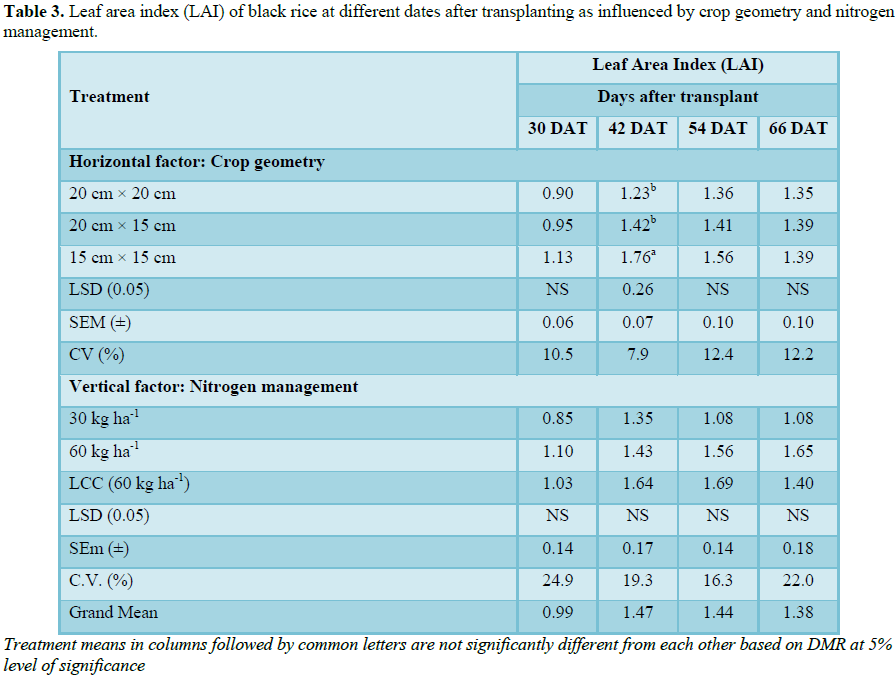
Generally, closer spacing (15 cm × 15 cm) had higher LAI as compared with wider spacing of 20 cm × 15 cm and 20 cm × 20 cm but there was significantly higher LAI as compared to the wider spacing of 20 cm × 20 cm only at 42 DAT (Table 4) [9-15]. It might be due to the significantly higher number of tillers at 42 DAT since higher number of tiller consists of higher number of leaves. LAI was comparatively higher in the closer geometry of 15 cm × 15 cm at all dates as compared to other crop geometry; it might be due to higher number of tillers per meter square produces more leaves per meter square results in higher leaf area in closer spacing. More number of leaves per unit results in more LAI hence more Leaf area in same land area consequently traps more light and CO2 resulting high photosynthesis capacity and produce more dry matter [16-19].
AGDM of black rice was found significantly higher in closer geometry (15 cm × 15 cm) than wider spacing 20 cm × 20 cm at only 42 DAT but generally closer spacing (15 cm × 15 cm) had higher AGDM as compared with wider spacing of 20 cm × 15 cm and 20 cm × 20 cm (Table 6). At 42 DAT both significantly higher tillers and LAI were obtained which might contribute to significantly higher AGDM. Similarly, at others DAT AGDM was non-significant between treatments as crop geometry but relatively higher AGDM was found in the closer geometry of 15 cm × 15 cm. It might be due to higher initial plant population in close geometry.
Effect of crop geometry on yield attributes and yield: Yield attributing characters, i.e., Panicle length, panicle weight, filled grain per panicle, 1000 grain weight and sterility percentage of black rice was found non-significant whereas effective tiller per meter square was significantly influenced by crop geometry (Table 8).
Effective tillers per meter square in crop geometry 15 cm × 15 cm were higher by 26.6% and 17.1% than crop geometry 20 cm × 20 cm and 20 cm × 15 cm, respectively (Table 8). The reason may be crop geometry 15 cm × 15 cm provides adequate scope to the plants for efficient utilization of solar radiation and nutrition than other geometries that favors for more mortality of tillers. Significantly higher number of effective tiller per hill was found in the close geometry of 25 cm × 15 cm than the wider geometry of 25 cm × 20 cm [5]. Similar results were obtained [10]. Grain yield was significantly higher in closer crop geometry 15 cm × 15 cm than geometry 20 cm × 15 cm and 20 cm × 20 cm (Table 9), which was mainly due to more number of effective tillers in same ground area, similar type of result was obtain by Yadav and Tripathi [20] and Padmaja and Reddy [9]. Similarly, in closer geometry, all yield attributing characters are comparatively higher which might also contribute higher yield in closer geometry.
Straw yield and Harvest index was found statistically at par as these were not influenced by different crop geometry (Table 9). These were found relatively higher in crop geometry with narrow row and plant space of 15 cm × 15 cm, this might be due to higher number of tillers in narrow crop geometry results higher straw yield [11] also found that straw yield increase as plant density increases and higher grain yield in closer geometry result higher harvest index.
Effect of crop geometry on content, uptake and use efficiency of N: The effect of crop geometry on nitrogen uptake by rice was non-significant. Similar result was reviled by Kumar et al. [17]. Partial factor productivity-Nitrogen (PFP-N), Nitrogen Efficiency Ratio (NER) and Internal Efficiency (IE) were not significantly influenced by crop geometry. Kumar et al. [17] also found these use efficiencies of nitrogen statistically similar.
Effect of crop geometry on the economics of black rice production: Cultivation cost was increased as geometry between crop and row decreases, this may be due to more seed requirement, more labor for transplanting and higher requirement of other input.
Gross return and Net return was significantly higher in narrow crop geometry 15 cm × 15 cm than other crop geometry of 20 cm × 15 cm and 20 cm × 20 cm (Table 13). This might be due to higher biological yield from narrow geometry. Mondal et al. [11] also found that high density paid highest gross and net return.
B:C ratio was non- significant among treatments but it goes on increasing as space between crops and rows goes on decreasing. Relatively higher B:C ratio was obtained from narrow crop geometry. Jena et al. [12] found that highest monetary return and highest B:C ratio was from plant spacing 15 cm × 15 cm.
Effect of nitrogen management practices
Effect of nitrogen management practices on phenology and growth of rice: Flowering and physiological maturity of black rice was found non-significant due to nitrogen management practices. Plant height was found significant in 30 and 66 days after transplant and found non-significant on other dates. This may be effect of N top dressed. Number of tillers per unit area was significantly influenced by N management only at 42 DAT but relatively higher number was found in LCC N management at all DAT (Table 3). Above ground dry matter and LAI was found non-significant in all dates after transplanting but it goes on increasing as plant growth progress. The above ground dry matter and LAI were found relatively higher as nitrogen dose increases.
Effect of nitrogen management practices on yield attributing and yield: Effective tiller per meter square was found statically similar but a relatively higher number were found in nitrogen applied using LCC followed by nitrogen rate of 60 kg ha-1and least in nitrogen rate 30 kg ha-1.
Panicle length and filled grain per panicle were significantly higher in nitrogen rate 60 kg ha-1ascompared to 30 kg ha-1and 1000 grain weight was found statistically similar. The reason behind the increase in panicle length and filled grain per panicle in higher nitrogen dose might be higher nitrogen nutrient takes part in panicle formation as well as panicle elongation and nitrogen helps in proper filling of seeds. Similar result was obtained by Salahuddin et al. [5], Haque et al. [14]. If we compare LCC with 60 kg ha-1 they were found statically similar in all yield determining attributes but LCC was found relatively higher in all attributes viz. Effective tiller m-2, filled grain per panicle, 1000 grain weight. Application of nitrogenous fertilizer according to demand of crop might be the reason behind for better rice growth parameter [13].
Grain yield of black rice was significantly influenced by different nitrogen management practices, yield in nitrogen management using LCC was higher by 11.38% and 24.5 0% than 60 kg ha-1 and 30 kg ha-1, respectively similarly yield in 60 kg ha-1 was significantly higher by 15.04% than yield in 30 kg ha-1. Higher yield was obtained when nitrogen dose was increased this might be due to a higher number of filled grain per panicle and longer panicle length [14,15], revealed that longest panicle was obtained when nitrogen dose was increased from controlled one. Higher yield in LCC might be due to the cumulative effect of yield attributes like grain per panicle, a number of effective tillers per meter square, relatively higher 1000 grain weight. Subedi et al. [16] reported that LCC management of N was more efficient and higher yielding.
Straw yield and harvest index were not significantly influenced by different nitrogen management practices, they were found relatively higher when nitrogen rate is increased from 30 kg ha-1 to 60 kg ha-1. Higher straw in higher nitrogen rate might be due to higher above ground dry matter production similarly higher harvest index in higher nitrogen applied plot might be due to higher grain production [19]. LCC was found relatively higher than nitrogen applied at the rate of 60 kg ha-1 this might be due to the application of nitrogen during plant demand which increases the dry matter and yield attributing characters.
Effect of nitrogen management on nitrogen content, uptake and use efficiency of nitrogen: Grain nitrogen uptake and total nitrogen uptake was significantly influenced whereas straw nitrogen uptake was not significantly influenced by different nitrogen management practices. Higher total nitrogen uptake in 60 kg ha-1 and LCC might be due to higher nitrogen uptake of nitrogen with higher availability. Similarly, total nitrogen uptake in LCC based nitrogen management is relatively higher than nitrogen applied at the rate of 60 kg ha-1 this might be due tofewer loss results more uptake of applied nitrogen. Similar result was found by [17].
Partial factor productivity of applied nitrogen (PFP-N) is significantly influenced by nitrogen management practices and found significantly higher in 30 kg ha-1 than others whereas nitrogen efficiency ratio and internal efficiency index (IE) were not significantly influenced by nitrogen management practices.
Effect of nitrogen management on the economics of black rice production: Cultivation cost was increased as nitrogen dose increased similar result was found when LCC is adopted, this might be due to increased nitrogen cost for the additional amount of nitrogen and the additional cost of labor for LCC adoption. Gross return and Net return was significantly higher in LCC based nitrogen management followed by 60 kg Nha-1.similarly the B:C ratio was significant among treatments, it goes on increasing as nitrogen rate goes on increasing and found significantly highest in LCC based nitrogen management than others. Maiti et al. [18] also favors the use of LCC for nitrogen management in rice as it is profitable.
Effect interaction between crop geometry and nitrogen management practices
Plant growth: The interaction effect was significant in LAI and AGDM at 42 DAT. Significantly higher LAI was obtained from interaction of Closer geometry (15 cm × 15 cm) with LCC based N management (1.991). It might be due to a higher number of tillers produced with higher number leaf in closer spacing and due to synchronization of crop demand for nitrogen resulting higher vegetative growth. Similarly, significantly higher AGDM was obtained from interaction of Closer geometry (15 cm × 15 cm) with LCC based N management (4.22 t ha-1). It might be due to higher vegetative growth i.e. tillers, leaf, in closer crop geometry.
Yield: The interaction effect between crop geometry and Nitrogen management Practices is significant in case of grain yield. Significantly higher grain yield was obtained from Closer geometry (15 cm × 15 cm) with LCC based N management (1.59 t ha-1) (Figure 3). Closer crop spaced Produce higher effective tillers [5] and demand based nitrogen application (i.e., LCC) produces number of filled grain and longer panicle length resulting higher yield.
Nitrogen uptake and efficiency: The interaction effect between crop geometry and nitrogen management practices is significant in grain nitrogen uptake. Significantly higher grain nitrogen uptake was obtained from treatment combination closer geometry (15 cm × 15 cm) with LCC based N management (21.21 kg ha-1). Field applied N adopting LCC and closer spacing had higher biological yield. Higher N uptake was obtained when better synchronization of N supply with crop N demand. Similarly, closer crop geometry consists of high density planting resulting higher biomass production and record higher nitrogen uptake.
CONCLUSION
1. Kushwaha UK (2016) Black rice anthocyanin content increases with increase in altitude of its plantation. Adv Plants Agric Res 5: 1-4.
2. Place GA, Sims JL, Hall VL (1970) Effects of nitrogen and phosphorus fertilization on growth, yield and cooking characteristics of rice. Agronomy J 62: 239-243.
3. Mahato M, Adhikari BB, Adhikari KR, Dahal KR (2016) Effect of planting geometry on yield and yield attributes of drought tolerant rice varieties in Nawalparasi, Nepal. Azarian J Agric 3: 86-89.
4. Basha J, Babu V, Kumar S (2017) Rice (Oryza sativa L.) response to planting geometry and method of planting. Int J N Technol Sci Eng 4: 2349-2780.
5. Salahuddin KM, Chowhdury SH, Munira S, Islam MM, Pravin S (2009) Response of nitrogen and plant spacing of transplanted aman rice, Bangladesh. J Agric Res 34: 279.
6. Dass A, Chandra S (2012) Effect of different components of SRI on yield, quality, nutrient accumulation and economics of rice (Oryza sativa) in terai belt of northern India. Indian J Agronomy 57: 250-254.
7. CRRI (1998) Effect of method of planting, spacing and seedling densities on the performance of hybrid rice. 1997-1998 Annual Report. Central Rice Research Institute, Cuttack, pp: 83-84.
8. Shah MH, Khushu MK, Khandey BA, Bali AS (1991) Effect of spacing and seedling per hillon transplanted rice under late sown conditions. Indian J Agronomy 36: 274-275.
9. Padmaja K, Reddy BB (1998) Effect of seeding density in nursery, age of seedlings and crop geometry on growth and yield of hybrid rice during wet season. Oryza 35: 380-381.
10. Srinivasan K (1990) Effect of plant spacing on ratoon rice performance. IRRN 15: 21.
11. Mondal MMA, Puteh AB, Ismail MR, Rafii MY (2013) Optimizing plant spacing for modern rice varieties. Int J Agric Biol 15: 175-178.
12. Jena S, Poonam A, Nayak BC (2010) Response of hybrid rice to time of planting and plant density. Oryza 47: 48-52.
13. Sathiya K, Ramesh T (2009) Effect of split application of nitrogen on growth and yield of aerobic rice. Asian J Exp Sci 23: 303-306.
14. Haque MA, Razzaque AHM, Haque ANA, Ullah MA (2012) Effect of plant spacing and nitrogen on yield of transplant aman rice var. BRRI dhan52. J Biosci Agric Res 4: 52-59.
15. Sharma ML, Mishra VR (1986) Effect of fertilizer nitrogen and algal inoculation on rice corp. Madras Agric J 71: 155-159.
16. Subedi P, Sah SK, Marahatta S, Regmi AP (2017) Need based nitrogen management in hybrid and improved rice varieties under dry direct seeded condition. J Agric Forestry Univ 1: 69.
17. Kumar D, Devakumar C, Kumar R, Das A, Panneerselvam P, et al. (2010) Effect of neem-oil coated prilled urea with varying thickness of neem oil coating and nitrogen rates on productivity and nitrogen-use efficiency of lowland irrigated rice under Indo-Gangetic plains. J Plant Nutr 33: 1939-1959.
18. Maiti D, Das DK, Karak T, Banerjee M (2004) Management of nitrogen through the use of leaf color chart (LCC) and soil plant analysis development (SPAD) or chlorophyll meter in rice under irrigated ecosystem. ScientificWorldJournal 4: 838-846.
19. Chaturvedi I (2006) Effect of nitrogen fertilizers on growth, yield and quality of hybrid rice (Oryza sativa). J Central Eur Agric 6: 611-618.
20. Yadav VK, Tripathi HN (1998) Effect of dates of planting, plant geometry and number of seedlings on growth and yield of hybrid rice (Oryza sativa L.). Agriculture.
-
 Table 1
 -
Table 2
-
Table 3
-
Table 4
-
Table 5
-
Table 6
-
Table 7
-
Table 8
-
Table 9
-
Table 10


QUICK LINKS
- SUBMIT MANUSCRIPT
- RECOMMEND THE JOURNAL
-
SUBSCRIBE FOR ALERTS
RELATED JOURNALS
- Food and Nutrition-Current Research (ISSN:2638-1095)
- Journal of Womens Health and Safety Research (ISSN:2577-1388)
- Journal of Biochemistry and Molecular Medicine (ISSN:2641-6948)
- Journal of Genetics and Cell Biology (ISSN:2639-3360)
- Journal of Astronomy and Space Research
- Journal of Microbiology and Microbial Infections (ISSN: 2689-7660)
- Journal of Genomic Medicine and Pharmacogenomics (ISSN:2474-4670)